About
The Watershed Project is a nonprofit based in Richmond, CA, whose mission is to inspire Bay Area communities to understand,largeppreciate, and protect our local watersheds. We hope that this website will help people learn about water quality and be interested in investigating their local creeks. Find out more about The Watershed Project at www.thewatershedproject.org.

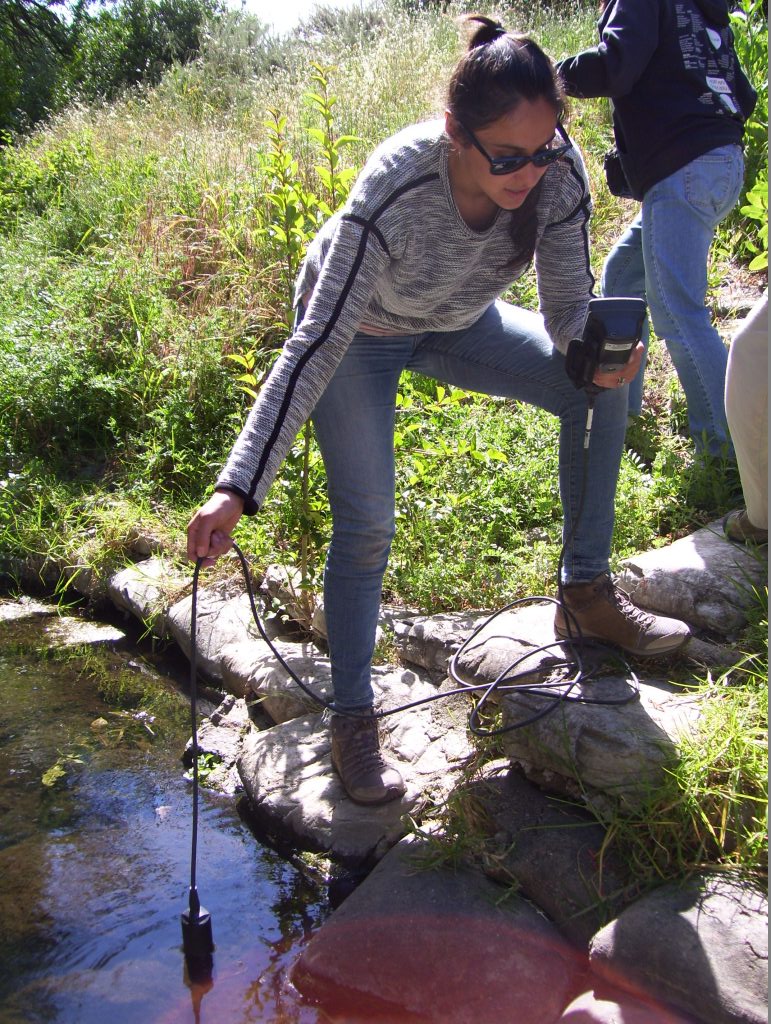
We could use your help! Our monitoring technicians need volunteers to help them collect their monthly data. Volunteers learn how to record data and use the water quality meters, and get to visit creek sites throughout Contra Costa County. Monitoring days last from about 9am-2pm, and are typically during the second week of the month. Please contact Satoko Mills at satoko@thewatershedproject.org for more information.
Methods
We follow protocols found in the California Waterboards Surface Water Ambient Monitoring Program’s Clean Water Team Guidance Compendium for Watershed Monitoring and Assessment for all of our monitoring activities. We calibrate meters before each monitoring day, check their accuracy after monitoring, and collect multiple data points per feature so that we can calculate field precision, ensuring our data is accurate and replicable. For more information on methods, please contact Satoko Mills at satoko@thewatershedproject.org.
Water Quality Thresholds are values of each feature, above or below which data is considered not ideal. For example, trout need water to be below 24 degrees Celsius, so that is the temperature threshold; any temperature data above 24 degrees Celsius is considered not ideal. Another example is dissolved oxygen: most aquatic life need at least 5 milligrams per liter of oxygen dissolved in the water to survive, and so any values below that are considered not ideal. Any data collected within the acceptable range is considered ideal.
Assessing creek health in urban streams can be tricky because most of these areas will never be pristine again, and the same is true of the water quality in the creeks. For example, while the EPA states that conductivity in streams should be between 50-500 uS/cm to best support aquatic life, other sources indicate that conductivity is not a “problem” in urban streams until it surpasses 2,000 uS/cm. While it is good to keep these differences in mind, for this application we’ve used the thresholds that are deemed best to support aquatic life rather than what is to be expected in urban streams.
For Vital Water Quality Features, for which data is collected monthly, Feature Scores are calculated based on the proportion of time a water quality feature was within the acceptable range.
- Good = if proportion is .9 or greater
- Marginal = if proportion is between .9 and .5
- Bad = if proportion is less than .5
For Benthic Macroinvertebrates data, scores are calculated based on the average tolerance values of the bugs found at a particular site (tolerance values range from 0 to 10, with 0 being the least tolerant to pollution and 10 being the most tolerant).
- Good: if average is 7 or greater
- Marginal: if proportion is between 3 and 7
- Bad: if proportion is less than 3
Copyright © 2020 The Watershed Project · App Created by FlowWest and Intelligent Ecosystems Institute
